
 Facebook
 X
X
 Pinterest
 Copy Link
Recent data from Fannie Mae reveals an interesting statistic: nearly one in four individuals still harbor concerns about a potential decline in home prices. If you find yourself among those worried about this possibility, it’s crucial to delve deeper into the reality of the situation.
Much of this apprehension likely stems from what you encounter in the media or online. However, it’s essential to remember that negative news often garners more attention. Consequently, you may only be exposed to a sensationalized or partial narrative. As noted by Jay Thompson, a Real Estate Industry Consultant:
“The housing market headlines are ubiquitous. Many tend to be sensational, often concluding with exclamation points or foreseeing imminent peril for the industry. Clickbait, characterized by sensationalized headlines and content, has plagued the internet since its inception, and housing news is not exempt.”
Let’s examine the data to dispel any misconceptions.
Home Prices: A Closer Look
Case-Shiller regularly publishes reports detailing monthly changes in home prices. Reviewing their data from January 2023 until the most recent figures, a clear pattern emerges:
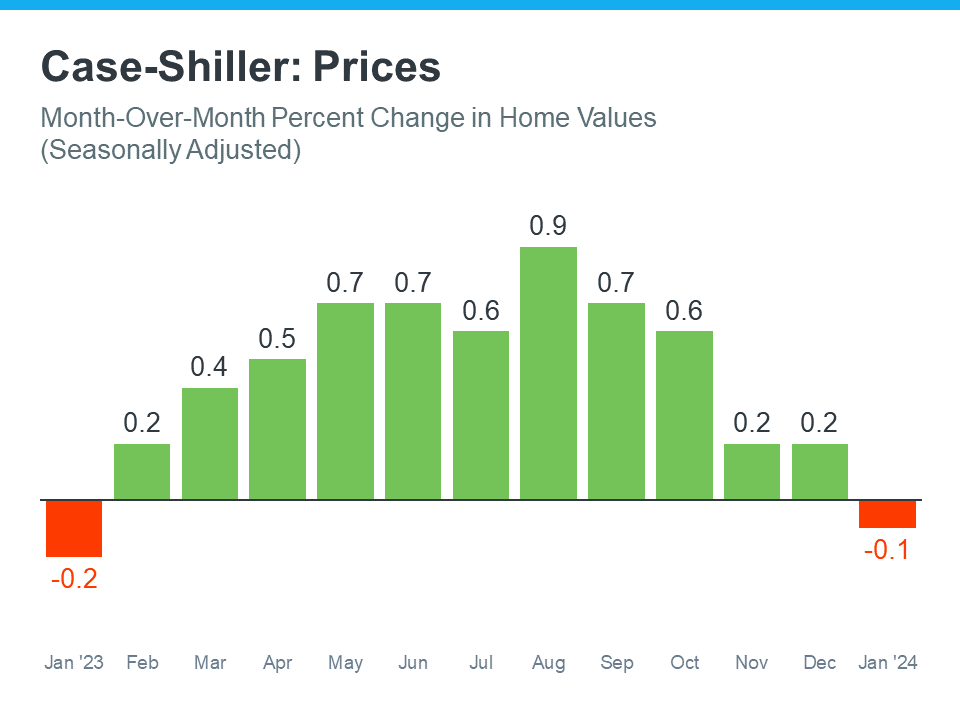
What catches your eye when observing this graph? Your perception may depend on the color that draws your attention. If you focus on the green bars, you’ll notice that home prices experienced a predominantly upward trend over the past year.
Conversely, if the red bars capture your gaze, you might only register the two minor declines. This selective focus is common in media coverage, where emphasis is often placed on negative fluctuations. However, it’s vital to maintain perspective.
In reality, the data indicates a prevalence of green bars, with the red ones representing minimal dips that are practically negligible. When viewed collectively, home prices exhibited overall growth throughout the year.
It’s customary for home price appreciation to decelerate during the winter months due to reduced activity around the holidays and the start of the year. Consequently, the latter portion of the graph depicts smaller price gains. Nonetheless, the overarching trend remains clear: prices increased last year.
To succinctly summarize, Case-Shiller, the source of the aforementioned data, elucidates:
“Month-over-month numbers remained relatively stable. . . However, annual growth was more pronounced for both indices, with increases of 7.4 percent and 6.6 percent, respectively.”
Given that even expert organizations tracking home price trends dismiss the minor declines as inconsequential, there’s little cause for concern. Case-Shiller underscores how these fluctuations were virtually flat and emphasizes the overall growth in home prices throughout the year.
In Conclusion
The data unequivocally demonstrates that, on the whole, home prices experienced an upward trajectory over the past year. If you seek clarity regarding home prices in your area, I’m here to provide insights and guidance. Let’s start a conversation.


